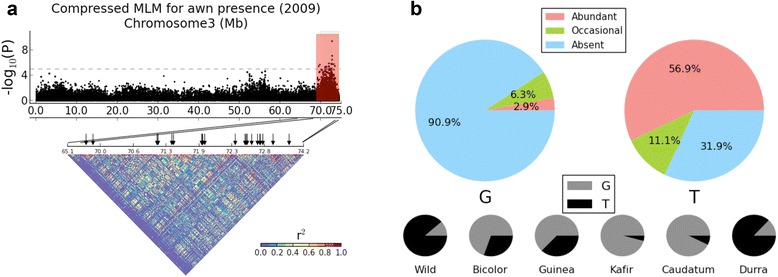
Figure 3.

The spectrum of awn presence variation and allele frequencies at locus “S3_72702502” on chromosome Sb03. (a) Chromosome Sb03 Manhattan plot for 2009 awn presence in sorghum is plotted with the hotspot (red area) identified by GWAS, with the prior interval (green area) determined by QTL mapping [24], and with the LD pattern determined by r 2. Significant association markers are denoted by black arrows. (b) Three types of awn classification, which are “abundant”, “occasional” and “absent” are color-coded in their frequencies plots for alleles “G” and “T”. The allele frequencies are plotted for the five main cultivated races and wild sorghum.
