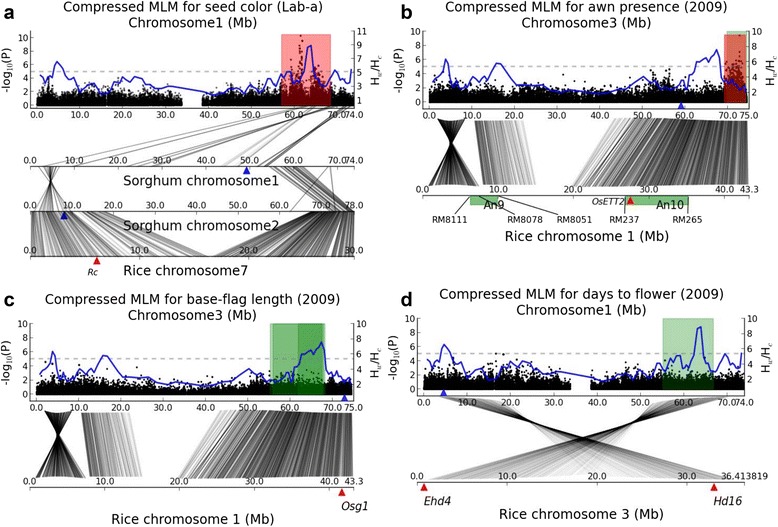
Figure 4.

Genetic correspondence across taxa. (a) Chromosome Sb01 Manhattan plot for pericarp color (a value of L*ab model) of sorghum is plotted with the hotspot (red area) identified by GWAS, and with the curve of Hw/Hc ratios. The Rc [52] gene is denoted by a red triangle. Two sorghum homologs of Rc on chromosomes Sb01 and Sb02 are denoted by blue triangles. Gray connecting lines indicate pairs of duplicated genes. (b) Chromosome Sb03 Manhattan plot for 2010 awn presence in sorghum is plotted with the hotspot (red area) identified by GWAS, and with the prior interval (green area) determined by QTL mapping [24]. Rice awns co-segregated with SSR marker RM8078 tightly linked to An9 on chromosome Os01 [63]. The interval An10 for rice awn [63] was associated with SSR markers RM265 and RM237 on chromosome Os01. The OsETT2 [64] gene is denoted by a red triangle. Sorghum ortholog of OsETT2 is indicated by a blue triangle. (c) The genomic interval (~55 Mb-67 Mb) on chromosome Sb03 is implicated by three linkage studies [14,26,28] to affect plant height and flowering time, but doesn’t harbor association signal in our GWAS. The Osg1 [66] gene and its sorghum ortholog are indicated by a red and a blue triangle individually. (d) The genomic interval (~58 Mb-64 Mb) on chromosome Sb01 is implicated by two linkage studies [24,26] to control plant height, but doesn’t harbor association signal in our GWAS. The genes Ehd4 [67] and Hd16 [68] are indicated by red triangles, and sorghum ortholog of Hd16 is denoted by a blue triangle.
