Figure 7.

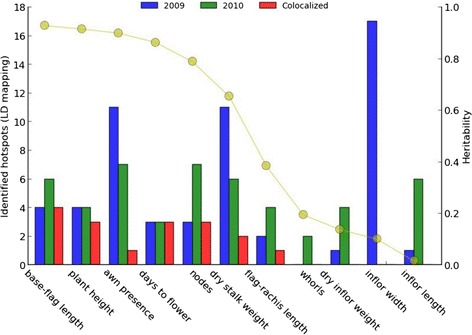
Summary of hotspots identified by GWAS for multi-year trait data. For each trait, numbers of hotspots for 2009, 2010 and both years are indicated with bars. The values of heritability for the traits are indicated with the curve.

Summary of hotspots identified by GWAS for multi-year trait data. For each trait, numbers of hotspots for 2009, 2010 and both years are indicated with bars. The values of heritability for the traits are indicated with the curve.