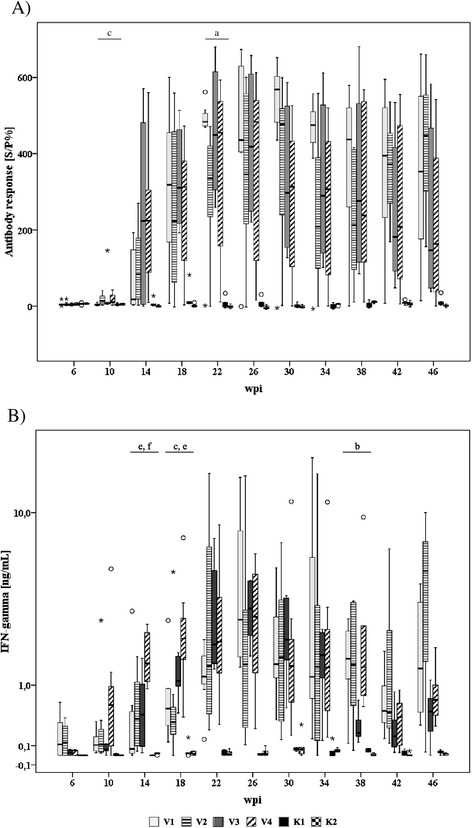
Figure 1.

Time course and intensity of MAP-specific antibody response (A) and antigen-induced (Johnin, 4 μg/mL) IFN-γ response (B) of inoculated and control goats. Box and Whisker Plot represents median value, 25% and 75% percentiles (box), range, outlier values (○), and extreme values (*). Different letters indicate significant differences between groups (Mann–Whitney-U test, P ≤ 0.05): a – V1 vs. V2, b – V1 vs. V3, c – V1 vs. V4, d – V2 vs. V3, e – V2 vs. V4, f – V3 vs. V4.
