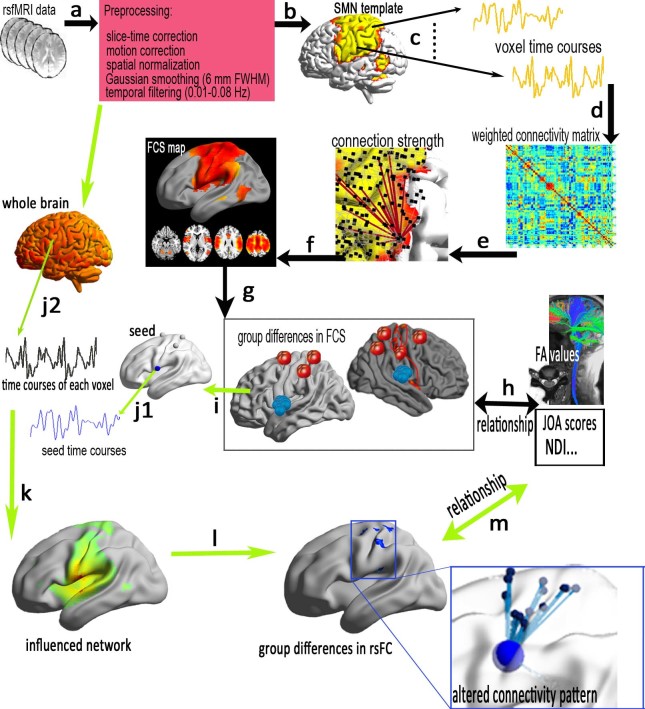
Figure 1. A flowchart of voxel-based intrinsic functional connectivity strength (FCS) and the influenced connectivity pattern in the sensory-motor network (SMN).
(a) Preprocessing of subject's resting-state fMRI data; (b) using a SMN mask for FCS analysis; (c)the time series of each voxel in the SMN template was extracted in MNI-space, and (d) then Pearson's correlation was used to construct the voxel-based weighted connectivity matrix; (e) for calculations of the connection strength, different r0 values (r0 = 0.1, 0.15, 0.2, 0.25, 0.3, 0.35, 0.4) were considered in this study; (f) the FCS map was constructed within the SMN; (g) group comparison of the FCS and(h) clinical metrics associated with the altered FCS of the SMN. To reveal the specific networks that were influenced by CSM, (i) the peak coordinates of regions with altered FCS were selected as the coordinates of the seed's centre, then time series was extracted in a spherical ROI of the seed (8-mm diameter, j1) and each voxel of the whole brain (j2); (k) calculated functional connectivity correlations and constructed influenced network, and a group comparison between the CSM and HSC groups (l); finally, statistical analysis of the relationship between the clinical metric and the average rsFC measured in the abnormal rsFC region between the groups (m).

