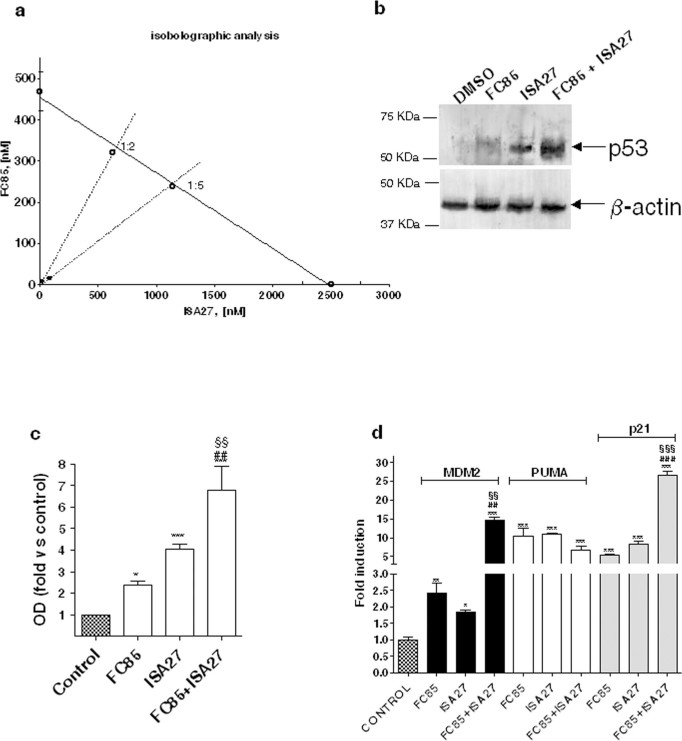
Figure 3. Synergistic effect of FC85 and ISA27 on the survival/growth of U87MG cells and on the reactivation of p53 pathway.
(a) Isobologram 2-D showing the interactions between FC85 and ISA27 in MTS viability tests performed in U87MG cells treated for 24 h with FC85 and/or ISA27. The IC50 values for FC85 and ISA27 are shown on the X- and Y-axis, respectively. The open points (○) on the additivity line depict the theoretical IC50,add values for total dose expressed as the proportion of FC85 and ISA27 that produced a 50% effect. The solid points (●) depict the experimental IC50,mix values for total dose expressed as the proportion of FC85 and ISA27 that produced a 50% effect. (b) U87MG cells were treated for 6 h with DMSO (control), 500 nM FC85 or 2.5 µM ISA27, alone or in combination. Lysates were subjected to western blot analysis using an antibody to p53. One representative Western blot is presented (b) for each cell treatment. β-actin was used as the loading control. The bar graph (c) shows the quantitative analysis of the Western blots, performed using ImageJ. The data are expressed as the percentage of optical density of the immunoreactive band relative to that of the control, set to 100%, and are the mean values ± SEM of three different experiments. The significance of the differences was determined with a one-way ANOVA with Bonferroni post-test: *p0.05, ***p<0.001 vs. control; ## p<0.01 vs. FC85 alone; §§ p<0.01 vs. ISA27 alone. Full-length blots are presented in the Supplementary Information section titled ‘‘Full-length blots relative to the cropped images showed in the main Figures”. (d) U87MG cells were treated as in b. The relative mRNA quantification of p53 target genes (PUMA, p21 and MDM2) was performed by real-time RT-PCR as describe in the Methods section. The data are the mean values ± SEM of three different experiments, each performed in duplicate. The significance of the differences was determined with a one-way ANOVA with Bonferroni post-test: *** p<0.001 vs. control; ## p<0.01, ### p<0.001 vs. FC85 alone; §§ p<0.01, §§§ p<0.001 vs. ISA27 alone.

