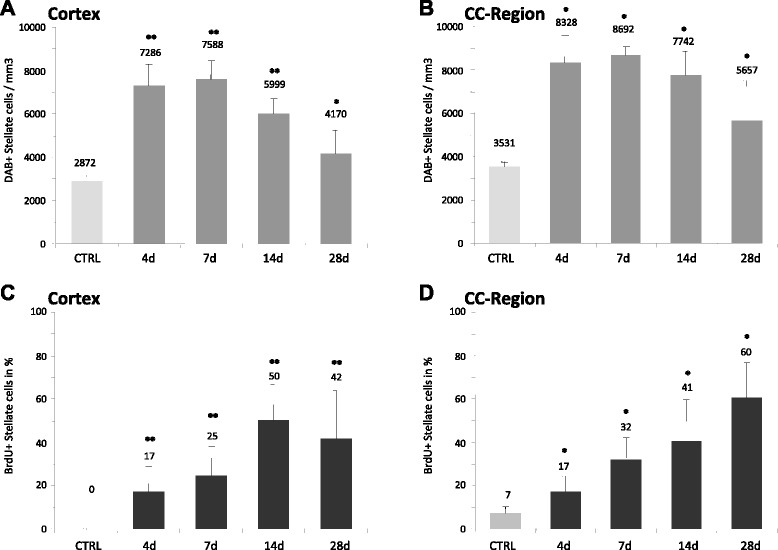
Figure 2.

Quantification of DCX+ stellate cells in the PZ. The number of DCX+ cells was quantified using semiautomatic stereology system and the optical-fractionator method. (A), (B), Total numbers of DCX+ stellate cells in the cortex and CC-Region, respectively. (C), (D), Percentage of DCX + stellate cells expressing the proliferation marker BrdU at different time points. Notably, the number of DCX+ stellate cells is similarly increased within both regions following ischemia. Bars represent Mean ± SD. Significant differences were indicated as follows: **(p < 0,01), *(p < 0,05).
