
Figure 3.
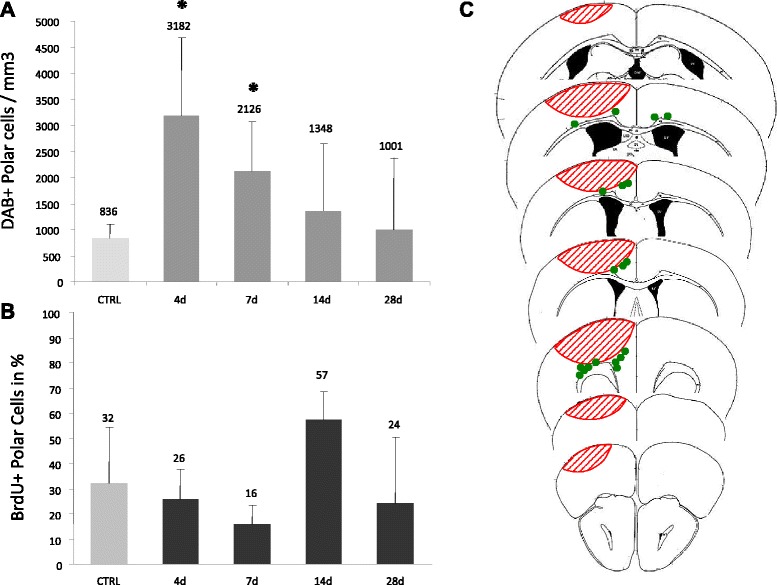
Quantification of DCX+ polar cells in the PZ. (A) Total numbers of DCX+ polar cells in CC-Region. (B), Percentage of DCX + polar cells expressing BrdU. (C), Green dots illustrate where polar cells were located in one representative animal. The counting was carried out manually because of the low numbers of polar cells. Bars represent Mean ± SD. Asterisks indicate significant differences: *(p < 0,05).