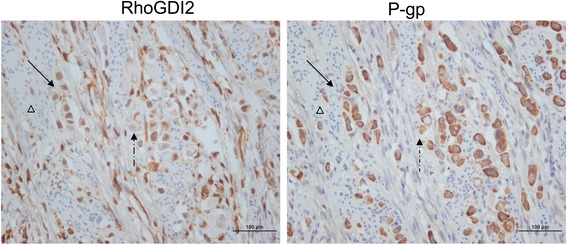
Figure 2.

Representative images of IHC staining with anti-P-gp and anti-RhoGDI2 demonstrate the co-expression of P-pg and RhoGDI2 in serial sections of gastric cancer tissue. Serial sectioning slices were stained with anti-P-gp and anti-RhoGDI2 from one case. Brown color represent positive of staining, the negative staining was contra-stained with hematoxylin and shown in blue color. Most of the cancer cells were positively stained with both anti-P-gp and anti-RhoGDI2. RhoGDI2 is expressed majorly in nuclear, whereas P-gp majorly presents in membrane. Some of the cancerous cells expressed high RhoGDI2 also were positively stained with anti-P-gp (shown in solid arrow), whereas some of the cancerous cells with lower RhoGDI2 were also weakly stained with anti-P-gp (shown in dashed arrow). The non-cancerous cells are negative for both P-gp and RhoGDI2 (marked with triangle). Magnification 400×. Scale bar = 100 μm.
