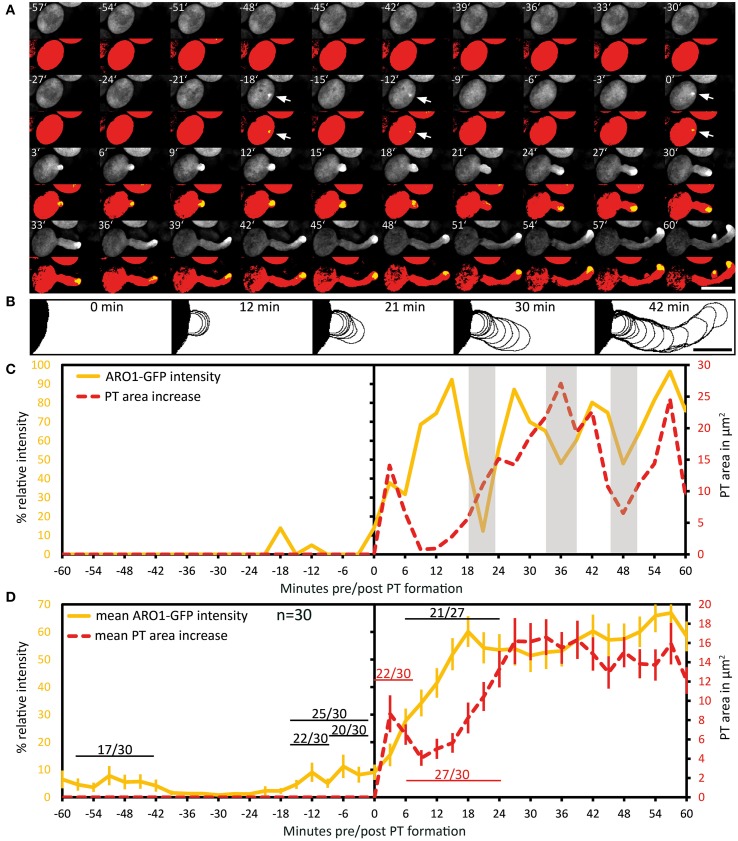
Figure 4.
Polarization of vesicle trafficking in activated pollen predetermines the site of pollen tube emergence. Time series of fluorescence signal in germinating pollen expressing PARO1:ARO1-GFP. Maximum intensity projected fluorescence raw signal and thresholded signals of a representative PT are shown in (A). GFP fluorescence is shown in yellow (0.5% of highest intensities), and in red (70% of highest intensities) representing the ARO1-GFP maxima and the pollen cytoplasm. Outlines of PT shape for successive frames are drawn in (B). The frame-wise increases in PT area over time and relative ARO1-GFP intensities for the PT in (A) are plotted in (C). Gray shaded areas indicate phases of PT growth reorientation. Mean value ± 1 SE of frame-wise PT area increase and normalized ARO1-GFP signal maxima for 30 PTs are given in (D). Numbers in (D) represent the frequency of an observed pattern. Time point 0′ indicates the last frame before germination. Arrows point to ARO1-GFP intensity maxima before germination. Scale bars: (A) 25 μm, (B) 10 μm.

