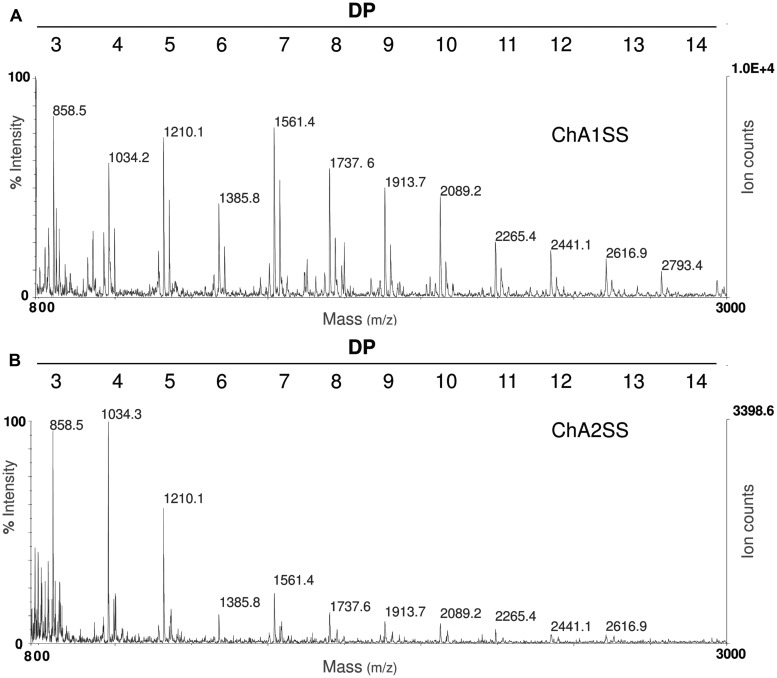
FIGURE 3.
Matrix assisted laser desorption ionization- time of flight (MALDI-TOF) mass spectrometry (MS) analysis of OGs recovered in the fractions ChA1SS (A) and ChA2SS (B) showing a different distribution of degree of polymerization (DP): the ChA1SS fraction shows a distribution of DP between 3 and 14 with the most intense peak corresponding to DP 7, while in the ChA2SS fraction the most intense peak corresponds to DP 4.

