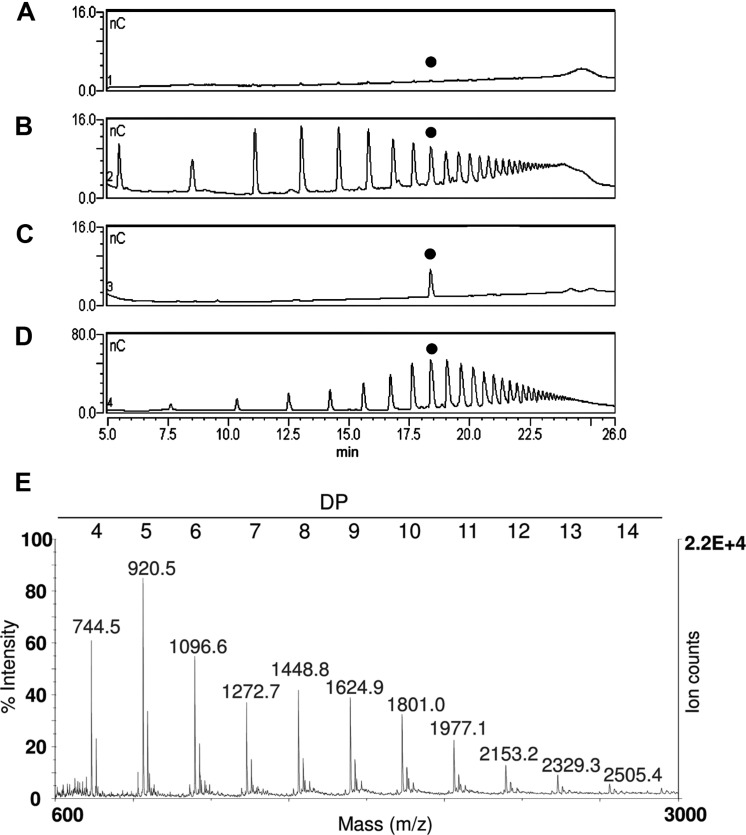
FIGURE 5.
The upper panel shows the HPAEC-PAD profiles of fractions extracted from leaves of plants of different age: (A) 3-week-old plants, (B) 7-week-old plants, (C) purified standard oligomer with DP 10, and (D) standard OGs with DP from 3 to 26. The peak corresponding to the oligomer with DP 10 is indicated with a black dot. (E) MALDI-TOF mass spectrum of the oligomers extracted from 7-week-old plants.

