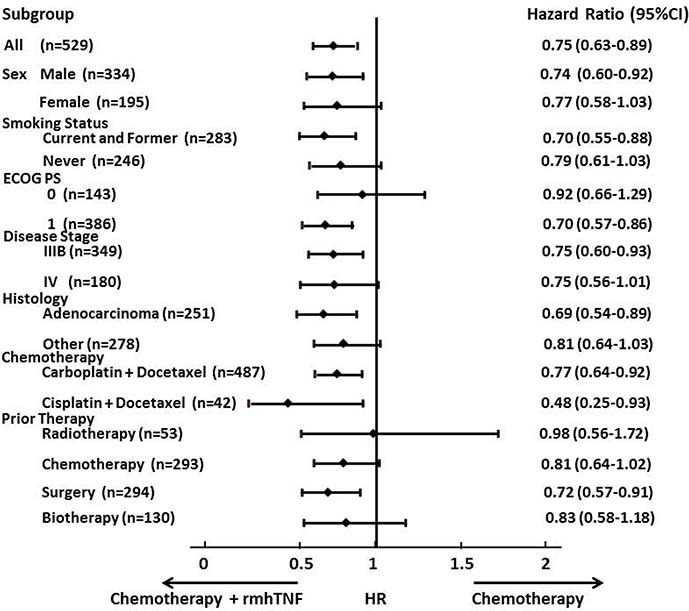
Figure 3. Forest plot of hazard ratios for overall survival assessed by subgroup factors.

Horizontal lines represent confidence intervals (CI). ECOG PS, Eastern Cooperative Oncology Group Performance Status.

Horizontal lines represent confidence intervals (CI). ECOG PS, Eastern Cooperative Oncology Group Performance Status.