Figure 6.
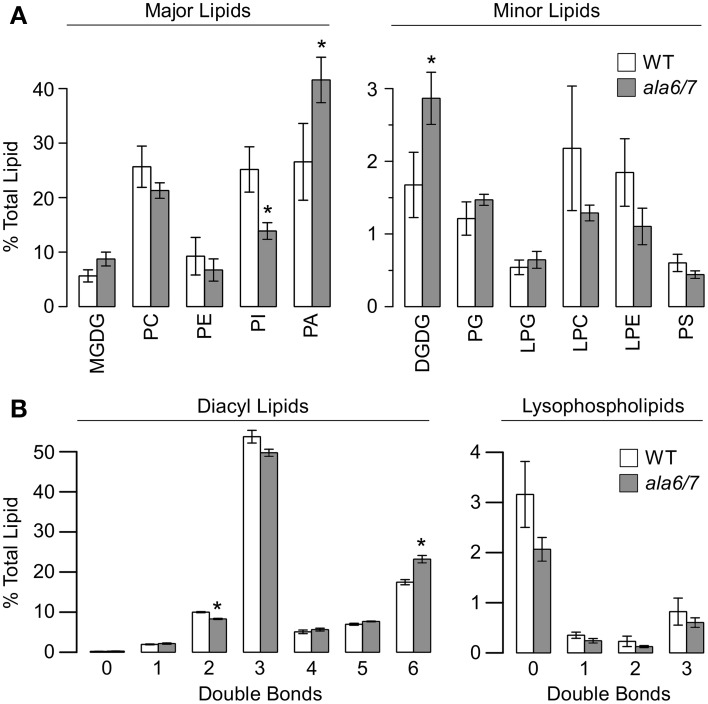
The quantification of lipid head-groups and unsaturation reveals significant differences between wild-type and ala6-1/7-2 pollen. Lipid concentrations were measured using tandem mass spectrometry (MS/MS) that detected 11 different head-groups and quantified the acyl carbons and double bonds within the corresponding acyl side chain(s). Concentrations are expressed as a percentage of the total lipid detected for a specific sample and are represented as mean ± SE, n = 4 for both WT and ala6-1/7-2. Pollen was collected from independent, parallel-grown, groups of ~75 plants. (A) Concentrations of lipid head-groups. Higher- concentration head-groups appear on the left and lower-concentration head-groups appear on the right. (B) Unsaturation in acyl side chain(s). Unsaturation in diacyl lipids (2 acyl chains) appears on the left and unsaturation in lysophospholipids (1 acyl chain) appears on the right. Abbreviations: MGDG, monogalactosyldiacylglycerol; PC, phosphatidylcholine; PE, phosphatidylethanolamine; PI, phosphatidylinositol; PA, phosphatidic acid; DGDG, digalactosyldiacylglycerol; PG, phosphatidylglycerol; LPG, lysophosphatidylglycerol; LPC, lysophosphatidylcholine; LPE, lysophosphatidylethanolamine; PS, phosphatidylserine. *Statistically significant difference between wild-type and ala6-1/7-2 (Welch's t-test, p<0.05).

