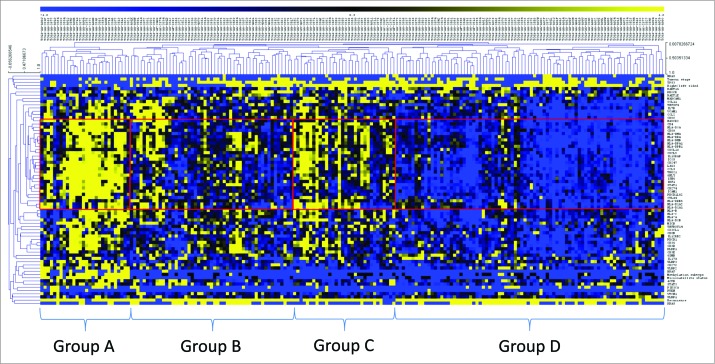
Figure 2.
Two-dimensional hierarchical clustering delineates distinct immunological CRC patient groups. Gene expression (yellow, high expression; black, intermediate; blue, low expression) was clustered together with mutation data of key genes (TP53, KRAS, BRAF, NRAS, PI3KCA and PTEN (yellow, mutant; blue, wildtype)) and clinical data (microsatellite status (yellow, MSI-H; black, MSI-L; blue, MSS), recurrence data (yellow, recurred/progressed; blue, disease-free), tumor site (yellow, left sided; blue, right sided), tumor stage (yellow, stage III/IV; blue, stage I/II), methylation subtype (yellow, CIMP-H; black, CIMP-L; blue, CIMP-negative). Clustering was performed by genes/mutations/clinical data (rows) and patients (columns) using the Pearson algorithm. Red boxes indicate groups of patients with strong clustering of the coordinate immune response cluster. Patients were delineated into four distinct groups (A–D) on the basis of the dendrogram and the cluster expression.

