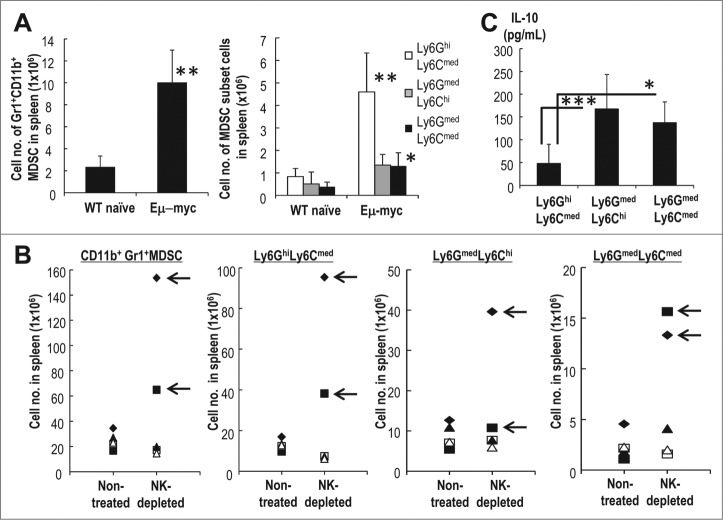
Figure 5.
Characterization of MDSCs in spontaneous lymphoma mice. (A) The absolute numbers of CD11b+Gr1+ MDSCs (a, left) or each subset of MDSCs (a, right) from naïve or Eμ-myc mice that had been developed with lymphadenopathy were measured (n = 5, mean ± SEM; **p < 0.01 and *p < 0.05 for WT naïve vs. Eμ-myc). (B) Ten Eμ-myc mice that had been 4 mo after a birth, but still did not develop the lymphadenopathy were assessed. In some mice, NK cells were depleted with anti-NK1.1Ab for one month (n = 5). One month later, the MDSCs in spleen were evaluated. Arrows in the figure indicate the development of lymphoma. (C) As shown in (A), splenic MDSCs from Eμ-myc mice with lymphadenopathy were stimulated with LPS, and the levels of IL-10 in the supernatants of the cell cultures were assessed by ELISA (n = 5, mean ± SEM; ***p < 0.001 Ly6GmedLy6Chi vs. Ly6GhiLy6Cmed, *p < 0.05 Ly6GmedLy6Cmed vs. Ly6GhiLy6Cmed).

