Figure 2.
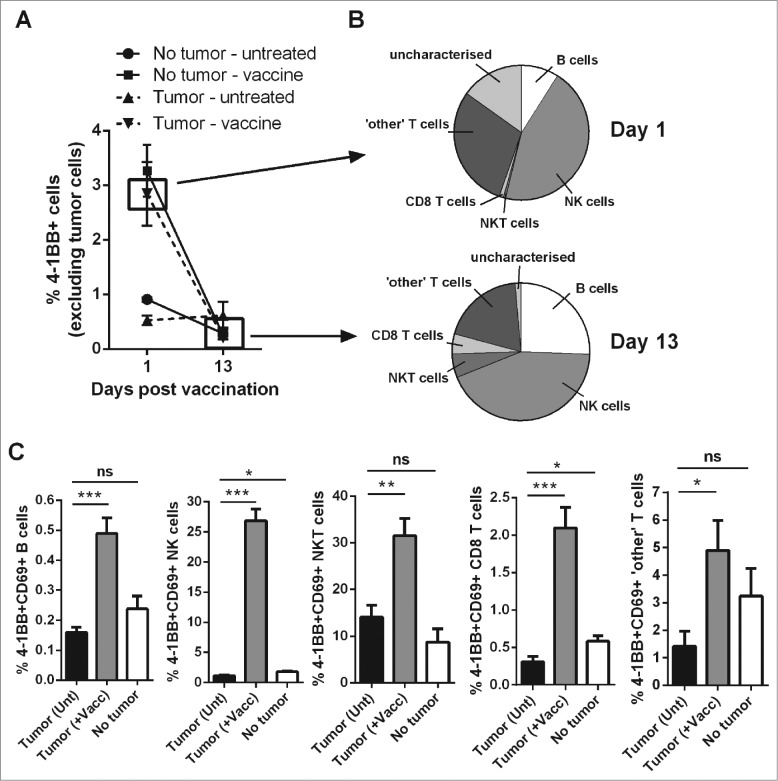
Vaccination increases the percentages of activated, 4–1BB-expressing lymphocytes. C57BL/6 wild-type (WT) mice were either challenged with 1 × 10⁵ Eμ-myc 4242 tumor cells or left tumor free, a group of each were then vaccinated on day 7 with α-GalCer-loaded tumor cells only. (A) The percentage of total peripheral blood cells (excluding tumor cells) that expressed surface 4–1BB on the indicated day post-vaccination. (B) The proportions of the indicated lymphocyte populations that constitute the total 4–1BB-expressing cell population in (A). Top pie chart refers to populations from the day 1 tumor-vaccine group. Bottom pie chart shows the equivalent group on day 13. 'Other' T cells refer to the CD8+ negative T cell population, which also excludes natural killer T (NKT) cells. (C) The percentages of activated 4–1BB+CD69+ lymphocytes 1 day after vaccination (+Vacc) compared to untreated tumor-bearing mice (Unt) and non-tumor-bearing controls (No tumor). Data in A-C show means ± SEM, n = 4–6 per group; *P < 0.05; **P < 0.01; ***P < 0.001, unpaired t-test.

