Figure 2.
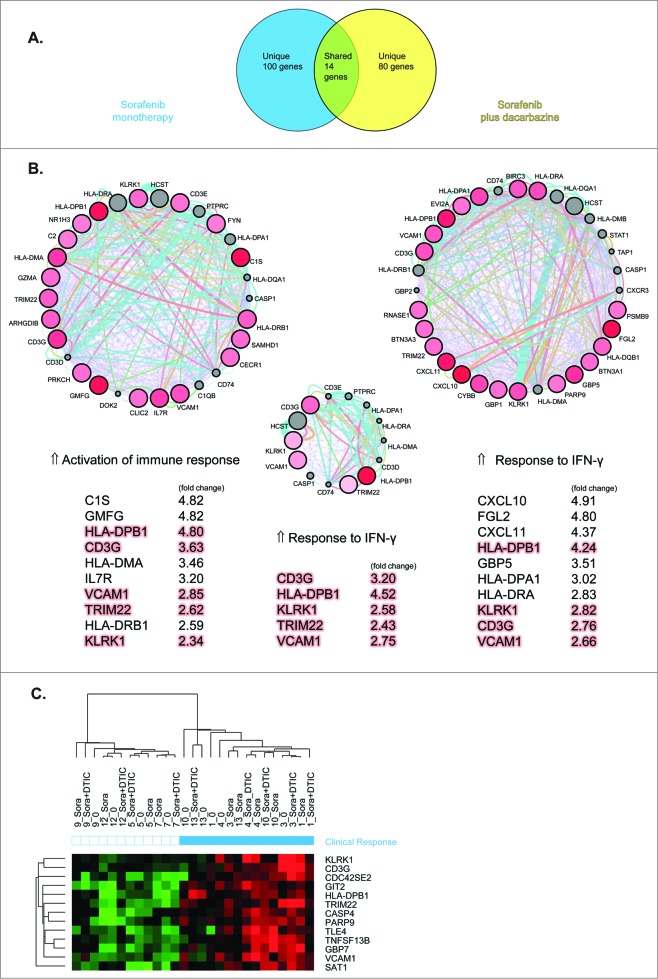
Gene predictors of clinical response of melanoma patients to therapy with sorafenib and/or dacarbazine. Differentially expressed genes from melanoma biopsy samples from patients (n = 9) treated with sorafenib (day 10) and sorafenib plus dacarbazine therapy (day 16) were analyzed for a correlation to clinical outcome. (A) Venn diagram representing gene predictors specific for or shared by sorafenib monotherapy or sorafenib plus dacarbazine therapy group. (B) Circle networks of most densely connected modules within treatment groups obtained by Genemania and MCODE plug-ins in Cytoscape. Shared genes by both groups are shown in the middle. The top upregulated genes are listed for each group and fold-change values to baseline are indicated. Orange highlights represent shared genes between the groups. Genes are identified by their gene symbols. (C) Two-way clustering analysis of the baseline, sorafenib (day 10) and sorafenib plus dacarbazine therapy (day 16) using 14 shared predictor genes. The similarity of gene expression profiles between examined samples is summarized in a dendrogram above the heatmap, in which the pattern and the length of the branches reflect the relatedness of the samples. The red color in the heatmap indicates a high relative level of expression, whereas the green color indicates a low relative level of expression. Clinical response is represented by blue squares, whereas non-responders are represented by white squares. Genes are represented by their gene symbols.

