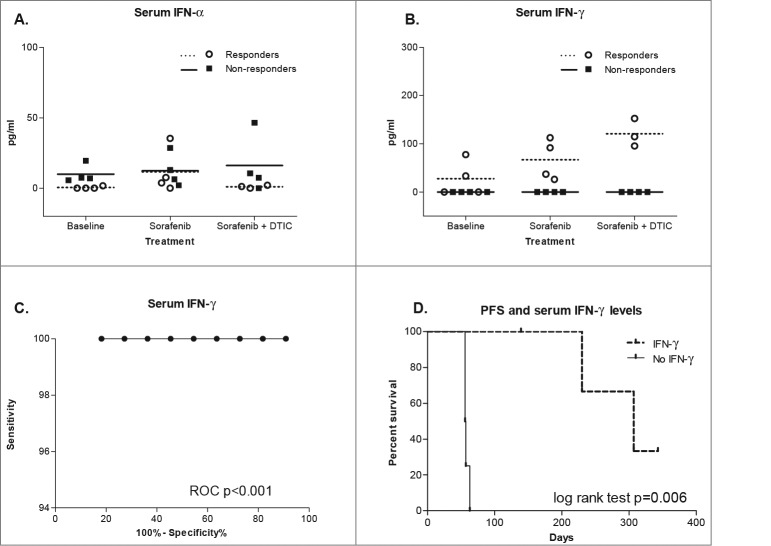
Figure 5.
Serum IFNα and IFNγ levels during therapy with sorafenib and/or dacarbazine. (A and B) Serum cytokine levels were measured by ELISA and tested by 2-way ANOVA. The scatter plots show individual interferon α (IFNα) and interferon γ (IFNγ) levels at baseline, day 10 (sorafenib) and day 16 (sorafenib plus dacarbazine) as well as their grouping according to response, the horizontal lines represent mean values of each response group. (B) ROC diagram depicts discrimination between responders and non-responders using IFNγ serum levels. (C) Kaplan-Meier curve depicts a difference in progression-free survival in study patients with detectable vs. undetectable serum IFNγ, as determined by log-rank test.

