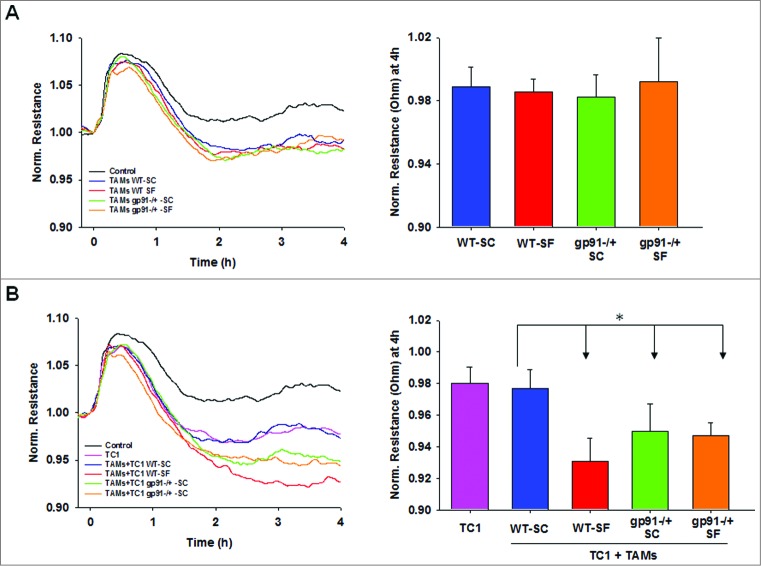
Figure 4.
Endothelial disruption induced by TAMs alone (A) and in co-culture with TC1 tumor cells (B). Time-course of normalized endothelial resistance (left) and their values 4h after adding cells to the endothelial monolayer (right). Upper panel represent the extravasation changes (reduced resistance) induced by addition of TAMs and lower panels shows changes after addition of both TC1 cells and TAMs. Data are presented as the mean ± SE (n = 6). *p < 0.05.

