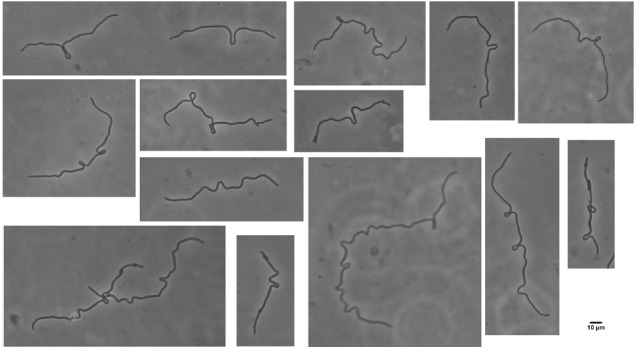
FIGURE 2.

Loop formation in the elongated cells after shift down. MNR2 eel cells from a 16h LBNS culture were plated on minimal medium slide cultures and photographed after 2.5 h. Scale bar indicates 10 μm for the entire figure. Loops form at some distance from the end and from each other but otherwise show no obvious pattern.
