Figure 2.

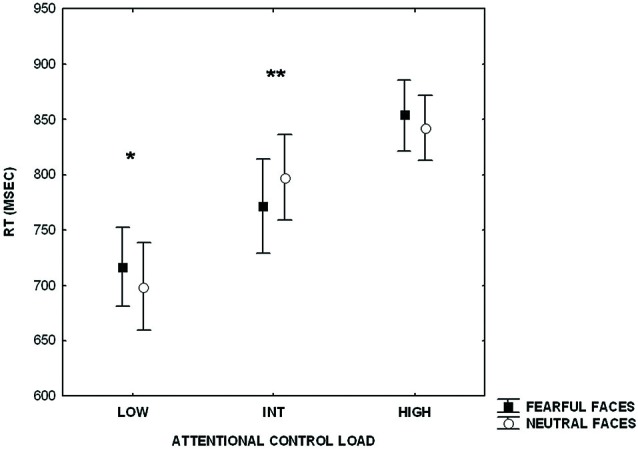
Plot showing reaction time (RT)s during processing of attentional control stimuli (LOW, INT, HIGH) after emotional stimuli (fearful and neutral faces). Measures presented are mean ± standard deviations. *p < 0.002, **p < 0.002.

Plot showing reaction time (RT)s during processing of attentional control stimuli (LOW, INT, HIGH) after emotional stimuli (fearful and neutral faces). Measures presented are mean ± standard deviations. *p < 0.002, **p < 0.002.