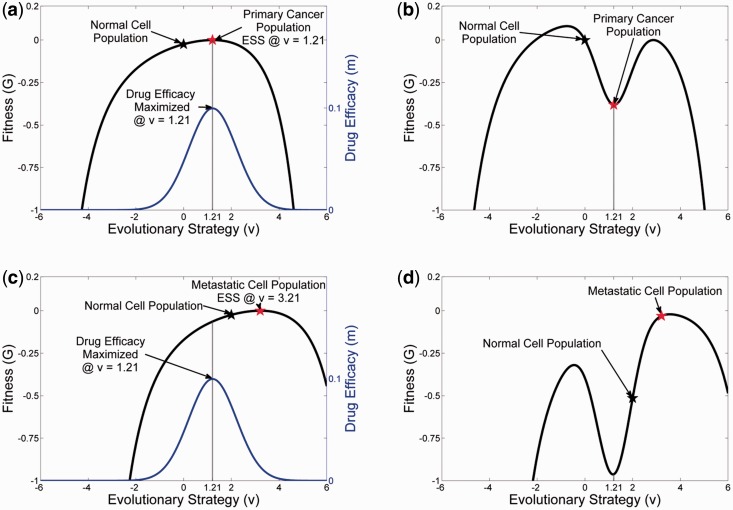
Figure 4.
The effect of targeted therapy on the primary tumor and the secondary tumor. Panel A shows the adaptive landscape of the primary tumor from Fig. 1 at time = 250. The tumor cells possess a strategy of u = 1.2 while the normal cells have the original strategy of u = 0. The simulated targeted therapy (blue) treats the cancer phenotype of the primary tumor by having a maximum cytotoxic effect on cells with u = 1.2. Panel B shows how therapy with this drug changes the landscape. The fitness of the primary tumor phenotype drops below zero while that of the normal cells drops slightly. The primary tumor cells will either go extinct or over time evolve a resistant phenotype of u = 2.86 (the subsequent ecological and evolutionary dynamics of resistance are shown in Fig. 5). Panel C illustrates how the targeted therapy for the primary tumor is ineffective in the secondary tumor where u = 2 and u = 3.21 for the normal and tumor cells, respectively (evaluated at time = 250 from Fig. 3). In fact the effect of the treatment on the adaptive landscape of the secondary tumor actually favors the tumor cells over the normal cells (Panel D). Figure 6 shows the ecological and evolutionary dynamics caused by this therapy in the secondary tumor

