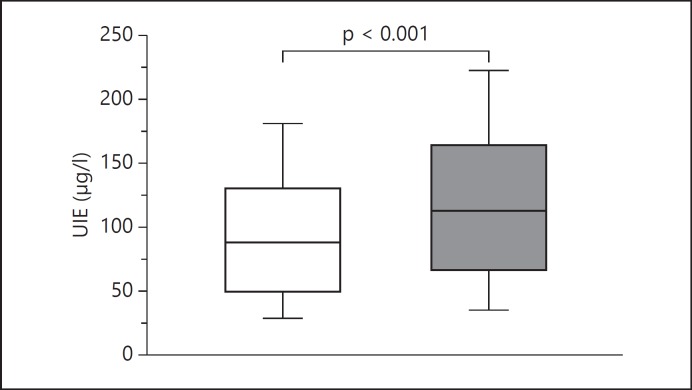
Fig. 1.
Box-whisker plot of urinary iodine excretion (UIE) measured in subjects not using (white box) or using (gray box) IS. Results are reported as median values (black lines), interquartile (25th to 75th percentiles) ranges (boxes) and 10th to 90th percentiles (whiskers). UIE was significantly higher in IS users than in non-users (Mann-Whitney U test: p < 0.0001).

