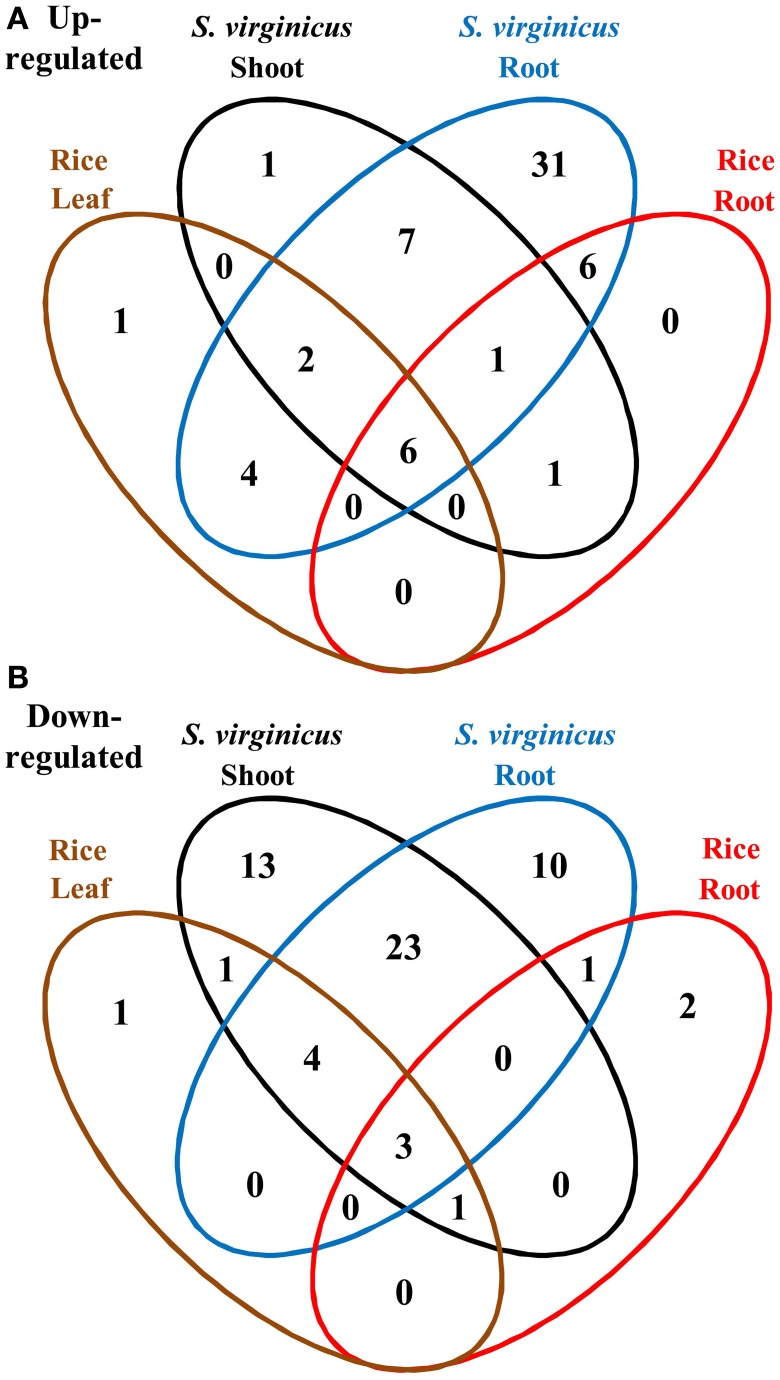
Figure 4.
Venn diagram of metabolic pathways enriched among differentially expressed unigenes under salinity. (A) Up- and (B) down-regulated pathways. Fifteen categories are represented by ellipses in different colors. Black: shoots of S. virginicus, blue: roots of S. virginicus, brown: leaves of rice, and red: roots of rice. The number of metabolic pathways in each category is shown.

