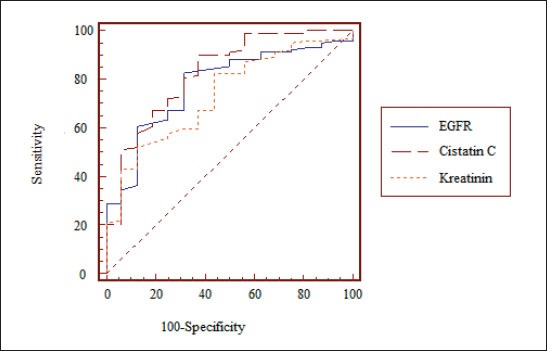
Figure 1.

ROC curve of sensitivity and specificity for cystatin C, creatinine and eGFR in relation to the presence of cardiovascular morbidity Notes: The area under the ROC curve -AUC for eGFR is 0,779 (standard error is 0,0711, confidence interval 95% CI -0,694 to 0,849) vs. AUC for serum creatinine of 0,736 (0,0581 with a standard error, confidence interval 95% CI -0,648 to 0,812) vs. AUC for cystatine C of 0,825 (a standard error 0,0447, confidence interval 95%Cl-0,745 to 0,889).
