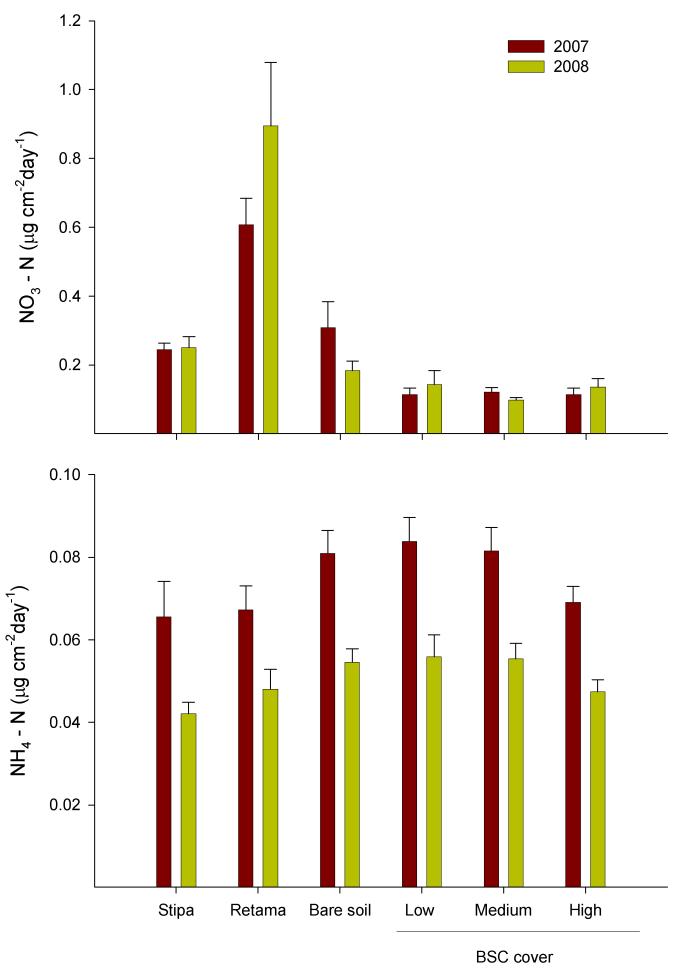
Figure 2.
Annual changes in NO3−-N (upper graph) and NH4+-N (lower graph) availability between five microsites in a semi-arid Stipa tenacissima steppe from central Spain. Stipa = Stipa tenacissima tussocks; Retama = Retama sphaerocarpa shrubs; Bare soil, Low, Medium and High indicate areas with very low (< 5% cover), low (5-25% cover) medium (25-75%) and high (> 75%) biological soil crust (BSC) cover. Note the differences in scale in the y-axis. Data represent means ± SE (n = 4 surveys). Data adapted from Castillo-Monroy et al. (2010).

