
Fig. 3.
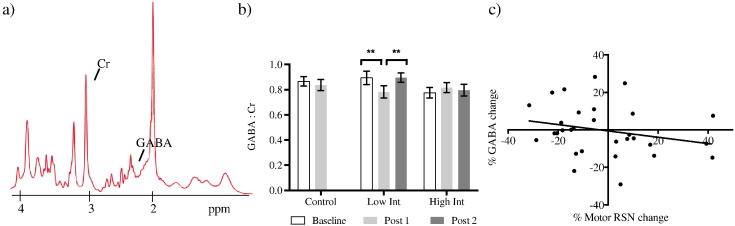
a) Representative MRS spectrum. b) GABA: creatine throughout time in each group. There is a significant difference between Baseline and Post 1 (**t(13) = 3.899, p = 0.002) and Post 1 and Post 2 (**t(13) = 3.075, p = 0.009) for the low intensity group only. **survives Bonferroni correction p < 0.016. c) GABA concentration change is negatively correlated with motor RSN change after learning (Spearman r = − 0.326, p = 0.039). Error bars represent SEM.