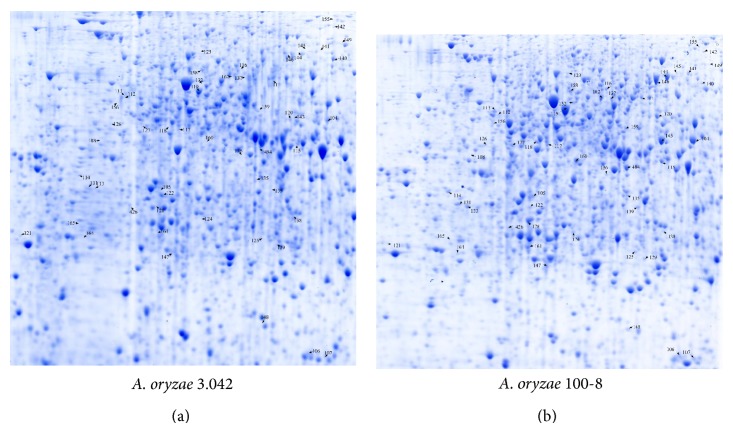
Figure 1.
The proteome analysis of A. oryzae 3.042 and 100-8 grown for 36 hours (pI 4–7) in amino acid catabolism. Different expressed proteins are marked by arrows and numbers and also listed in Table S2 (see Supplementary Material available online at http://dx.doi.org/10.1155/2015/456802).

