
Fig 2.
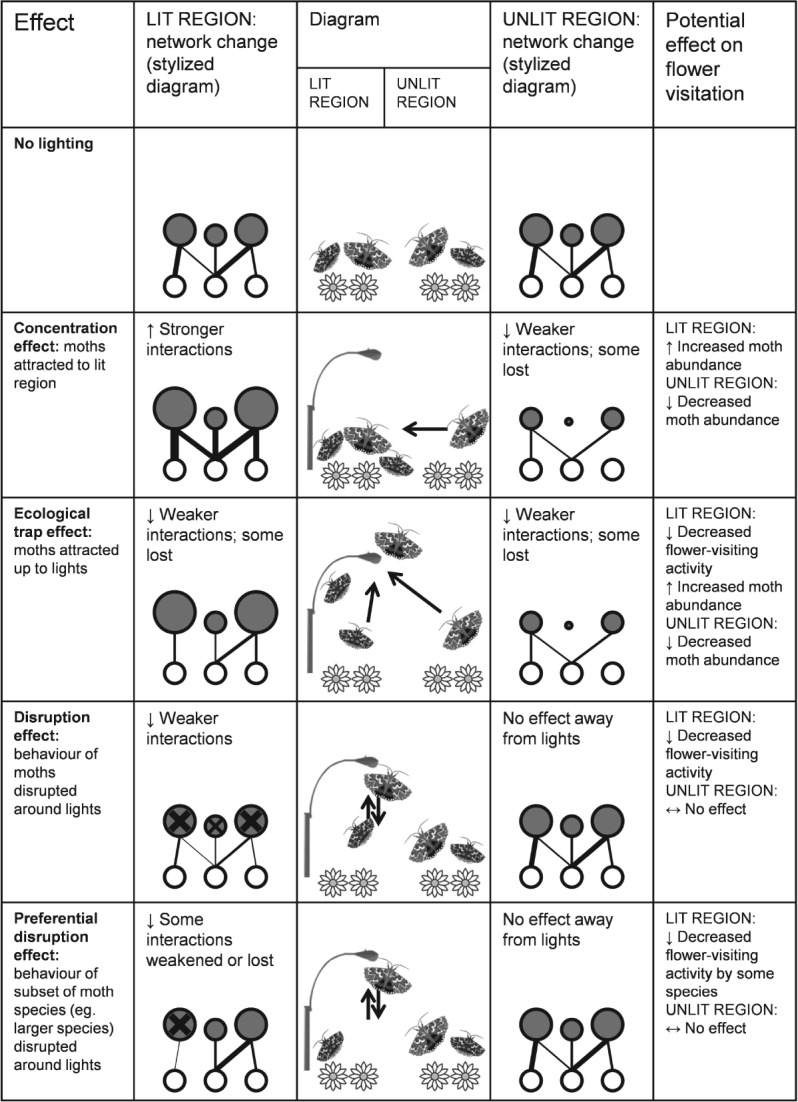
Possible scenarios for change in plant–moth pollination networks as a result of artificial night lighting, with predictions for effects on local flower-visitation activity by moths. In network representations, nodes represent species (lower = flowering plants, upper = moths) and links represent pollination interactions. Node width represents relative species abundance and link thickness represents interaction strength. Crosses indicate disruption of behaviour.