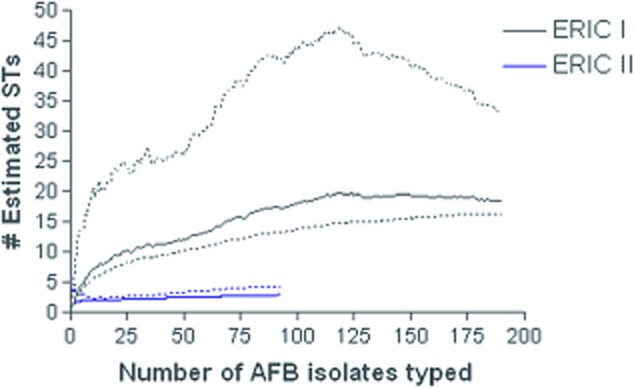
Fig 3.

Chaol estimates of ERIC I and ERIC II ST richness as a function of sample size. Dotted lines are 95% CIs and were calculated with the variance formula derived by Chao (1987). The lower solid line represents ERIC II and the upper solid line represents ERIC I.
