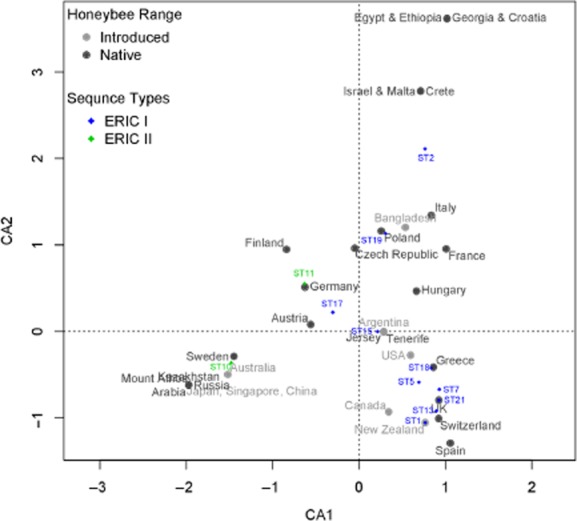
Fig 5.

Correspondence analysis ordination graph. The CA ordination graph illustrates the associations among countries of isolate origins and MLST STs. Filled circles represent countries (dark grey represents native host range, light grey represents introduced host range) Diamonds represent STs.
