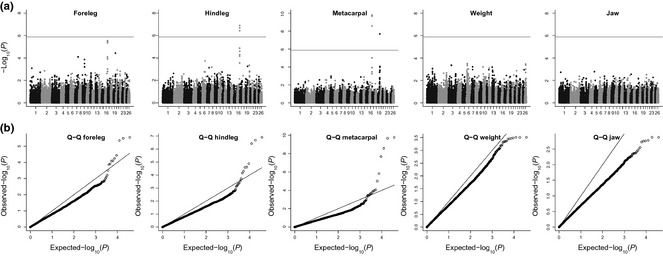
Figure 3.

(a) genome‐wide association (GWAS) of body size traits in Soay sheep. All points above the solid line are genome‐wide significant after Bonferroni correction for multiple testing. (b) Q‐Q plot showing the observed distribution of P values against the expected P values under the null hypothesis of no association. The solid line indicates the one to one line. Generally the P values are below the solid line, indicating that our P values are deflated. From left to right, inflation factors (λ) were 0.76, 0.74, 0.82, 0.67 and 0.61. Test statistics as shown in the top panel have not been adjusted using genomic control.
