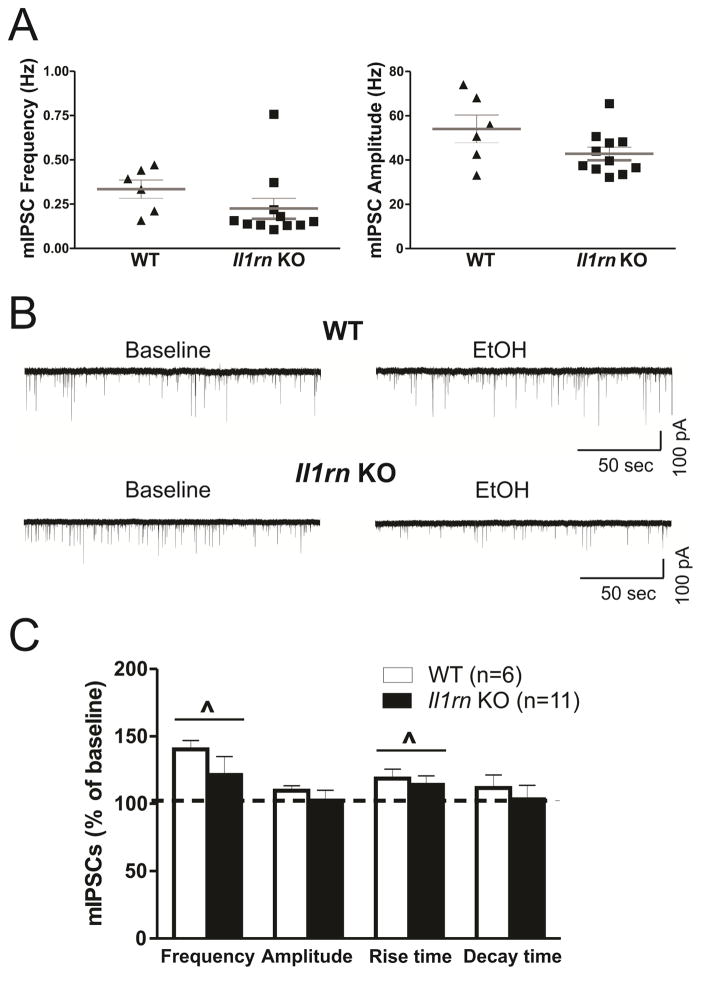
Figure 4. Deletion of Il1rn alters ethanol effects on action potential-independent GABA transmission in CeA.
A) Scatter graphs of mIPSC frequencies and amplitudes of individual CeA neurons from WT (n=6) and Il1rn KO (n=11) mice. B) Representative recordings of mIPSCs from neurons following acute ethanol application. Top panel: traces of mIPSCs from a WT neuron before (left) and during 44 mM ethanol application (right). Bottom panel: traces of mIPSCs from a KO neuron showing ethanol-induced decrease in the mIPSC frequency. C) The comparison of ethanol effects on the mean mIPSC frequency, amplitude, and rise and decay times between CeA neurons from WT and Il1rn KO mice. Two-way ANOVA showed a significant main effect of ethanol (F(1,15)=6.48; ^p < 0.05) on the mean mIPSC frequencies in WT and Il1rn KO mice and a significant effect of ethanol on mIPSC rise time (F(1,15)=5.68, p < 0.05).

