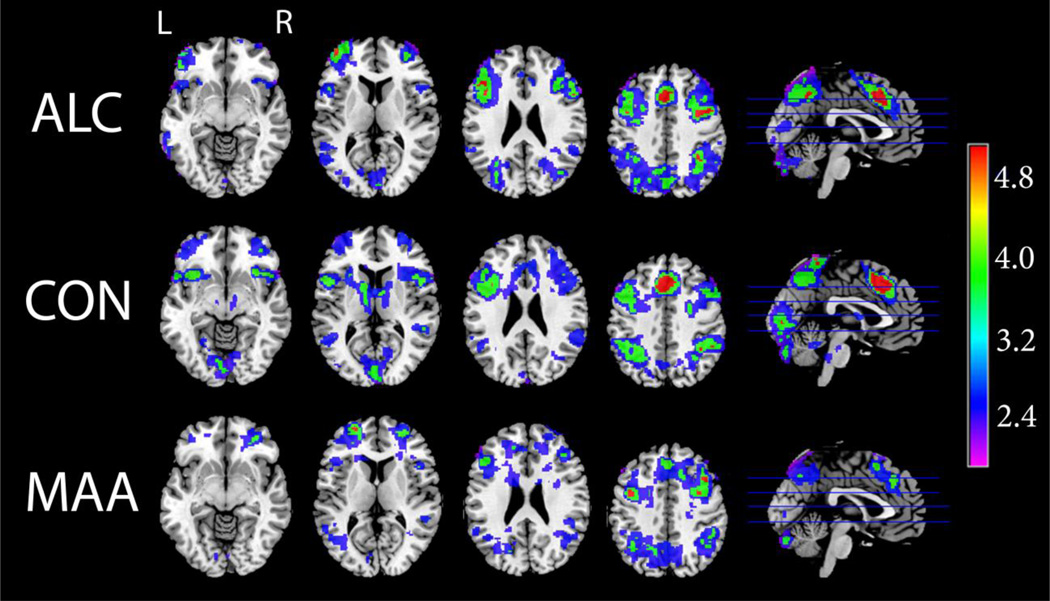
Figure 2. Visuo-spatial N-Back: Group Average Activation Maps.
Axial and sagittal sections displaying group average activation maps during the visuo-spatial n-back working memory task. Shown here are regions of significantly (Z>1.7 and a corrected cluster significance threshold of p=0.05) greater activation during working memory (2-back – 0-Back contrast). Colors on the maps correspond to the color bar on the right.

