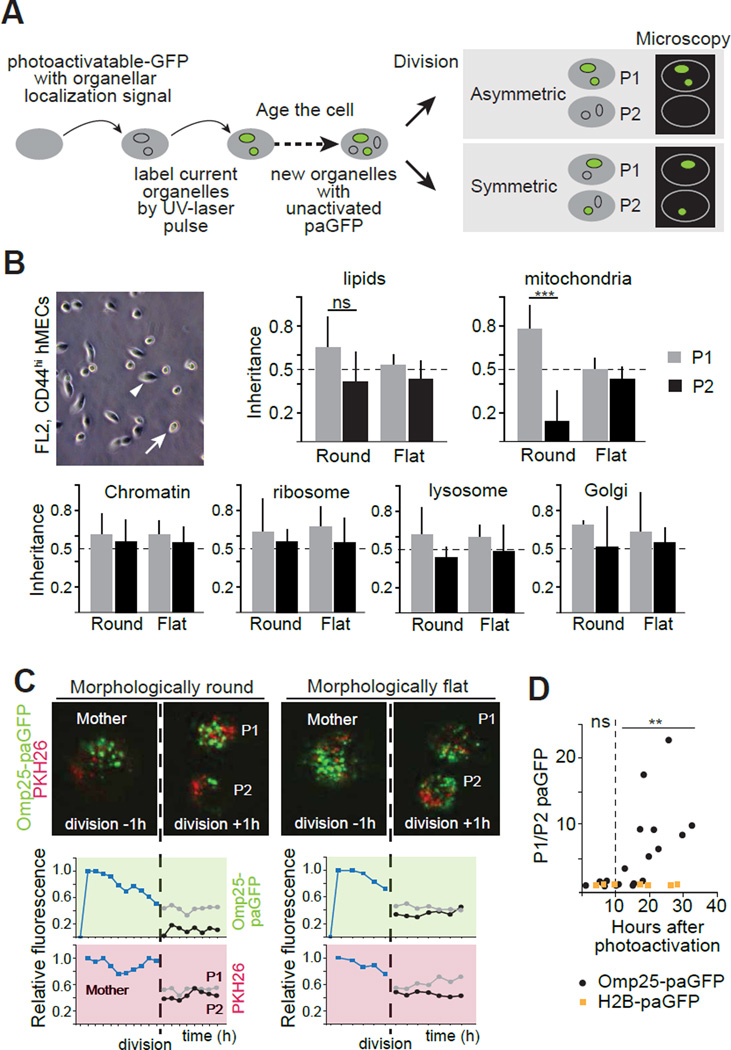
Fig. 1. Asymmetric apportioning of aged mitochondria during cell division.
(A) Schematic of the labeling strategy using paGFP. (B) Analysis of apportioning of a fluorescent lipid dye, and of green fluorescence marking five paGFP-targeted organelles during cell division in epithelial (morphologically flat, arrowhead), and stem-like (morphologically round, arrow) cells in cultures of human mammary epithelium cells (hMECs). P1 and P2 indicate daughter cells, with P1 being the daughter receiving more of the targeted organelle. Inheritance indicates fluorescence of daughter cells relative to that of the mother cell scaled to 1. (C) Dynamics of mitochondrial apportioning in round SLCs and flat epithelial cells. Representative divisions are shown with mitochondria in green (paGFP-Omp25) and the lipid dye (PKH26) in red. Images are frame captures from one hour before and after division, and fluorescence intensity per cell is plotted at one-hour intervals. (D) Analysis of asymmetric apportioning as a function of label age. SLCs dividing more than 10 hours after label activation show increasing asymmetric apportioning of mitochondria (Omp25), but not a chromatin label (H2B). Each data point represents an individual cell division. (**p<0.01, ***p<0.001, t-test)

