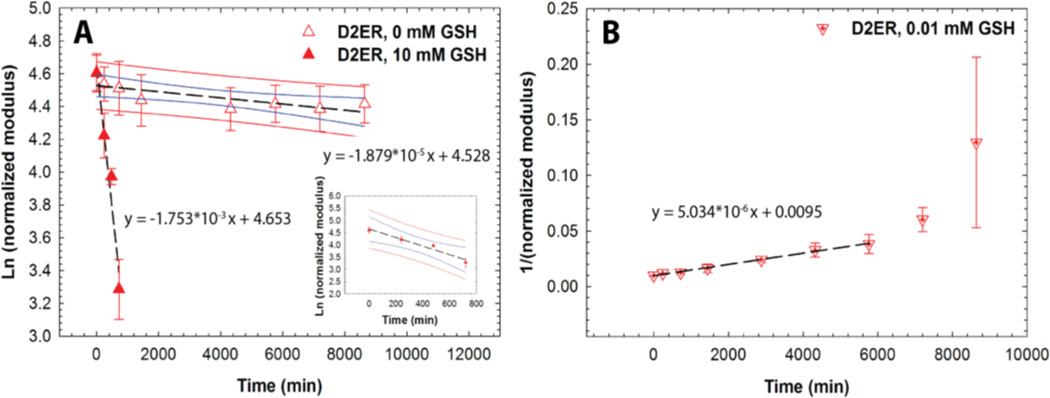
Fig. 6. Reducing environment-dependent degradation kinetics. A).
D2ER hydrogels exhibited first order degradation kinetics in a strong reducing microenvironment (10 mM GSH), whereas limited degradation is observed in a thiol-lacking microenvironment (0 mM GSH), owing to the slow rate of ester hydrolysis. Data point for 0 mM GSH at 2880 minutes was identified as a significant outlier (Grubb’s test, p < 0.05) and hence omitted during regression analysis. B) D2ER hydrogels followed second order reaction kinetics in a weak reducing microenvironment (0.01 mM GSH). Later time points were omitted during the regression analysis, due to large standard error, which can be attributed to experimental limitations when handling soft, more liquid-like degraded gels. As a whole, this study highlights the dependence of hydrogel degradation on GSH concentration. The data shown illustrate the mean (n = 6), with error bars showing the standard error. Black line indicates the linear fit using regression analysis. Blue and red lines indicate 95% confidence and prediction bands.

