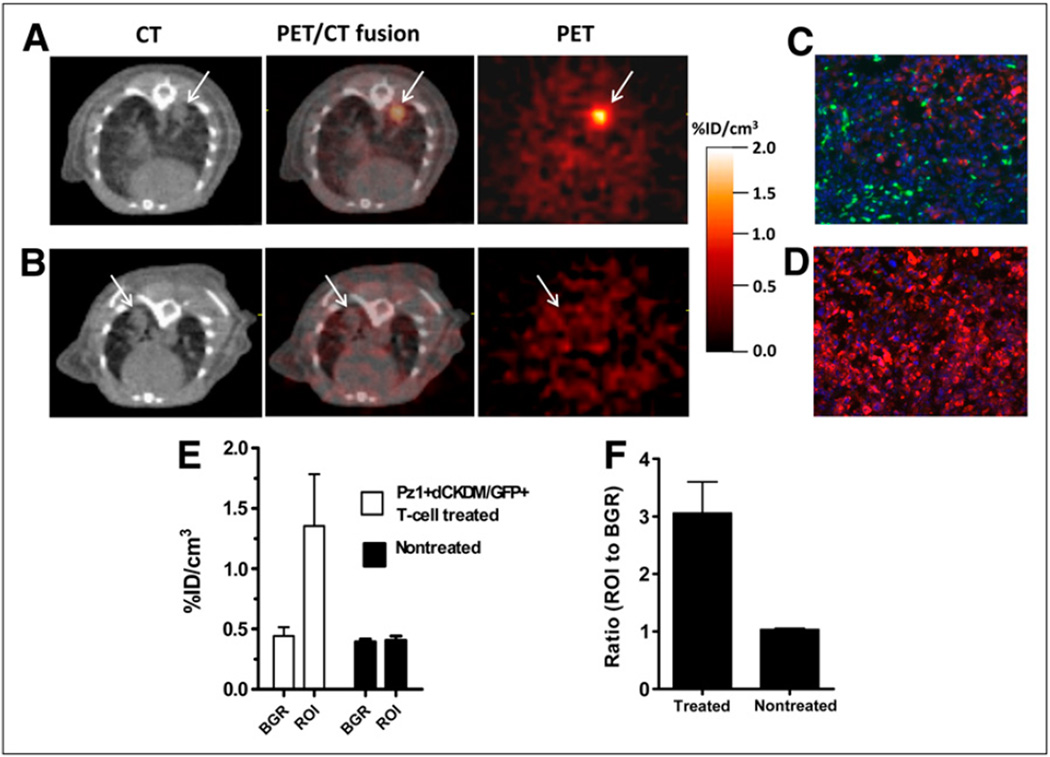
FIGURE 4.
Small-animal PET/micro-CT of dCKDM/GFP-expressing T cells: colocalization of 18F-FEAU accumulation in small-animal PET images with tumor regions in micro-CT images. Representative tumor-bearing animals from Pz1+dCKDM/GFP+ treated (A) and control nontreated (B) groups are shown. High 18F-FEAU accumulation was detected on day of T-cell administration in region corresponding to tumor foci on micro-CT image in Pz1+dCKDM/GFP+ treated animal. No 18F-FEAU accumulation was observed in region corresponding to tumor foci in nontreated control animal. Heart and blood vessels were enhanced by iodinated lipids. Immunofluorescent analysis revealed presence of GFP-positive (green, stained with anti-GFP antibody) T cells infiltrating hPSMA-positive (red, stained with anti-hPSMA antibody) tumor in lung from representative Pz1+dCKDM/GFP+ T-cell–treated (C) and –nontreated tumor-bearing (D) animals. Nuclei were stained with 4,6-diamidino-2-phenylindole (blue). Magnification, ×10. Quantitative analysis of 18F-FEAU-accumulation (E) and region-of-interest–to–background ratios (F) in treated and nontreated groups is presented. Data are expressed as percentage injected dose per cubic centimeter of tissue (%ID/cm3). Values are mean ± SD, n = 5. BGR = background; ROI = region of interest, marked with arrow.

