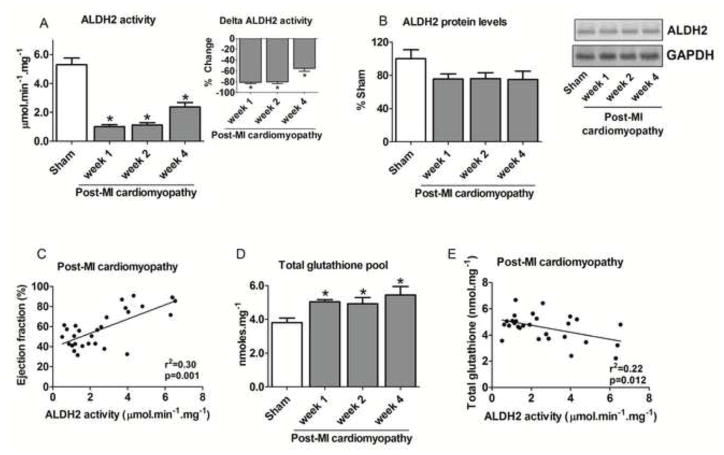
Figure 5. Cardiac ALDH2 profile and glutathione levels during the progression of post-MI cardiomyopathy.
(A) Cardiac ALDH2 activity (input: delta ALDH2 activity); (B) Cardiac ALDH2 protein level and representative western blots showing the level of cardiac ALDH2; (C) Correlation between ventricular ejection fraction and cardiac ALDH2 activity; (D) Total glutathione levels; (E) Correlation between ALDH2 activity and total glutathione levels in control (sham, white bars, n=9) and post-MI cardiomyopathy rats at weeks 1 (n=8), 2 (n=13) and 4 (n=11) after LAD occlusion surgery. Cardiac ALDH2 protein level was normalized by GAPDH and expressed as % sham. Data are means ± SEM. *, p<0.05 vs. control (sham) rats.

