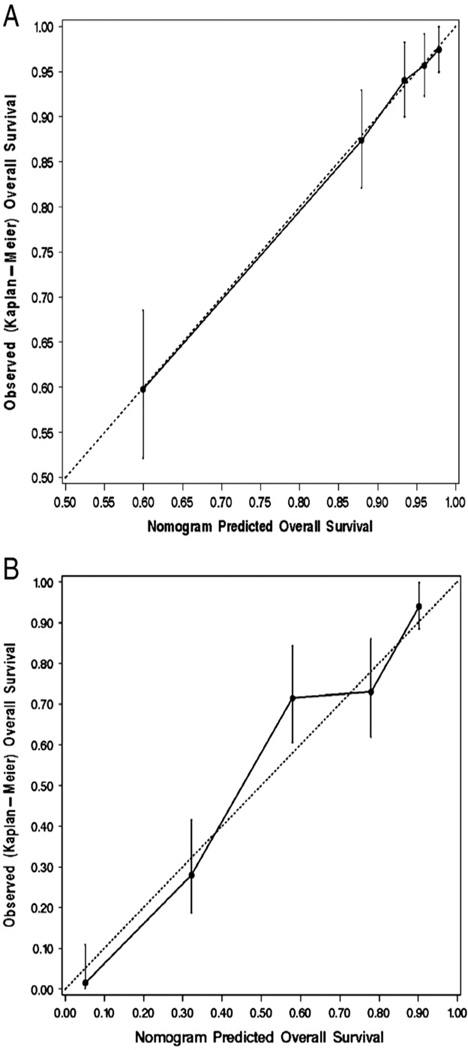
Fig. 2.
A. Calibration plot for 5-year overall survival (OS) probability based on the multivariable models for low-risk patients. B. Calibration plot for 5-year overall survival (OS) probability based on the multivariable models for high-risk patients. The dashed line indicates the ideal reference line where the predicted 5-year OS probabilities estimated from each model would match the Kaplan–Meier estimates of 5-year OS. Patients were grouped into quintiles according to their 5-year OS probability predicted by the final model. The vertical bars denote the 95% confidence interval for the Kaplan–Meier OS estimate derived for the patients in each quintile.

