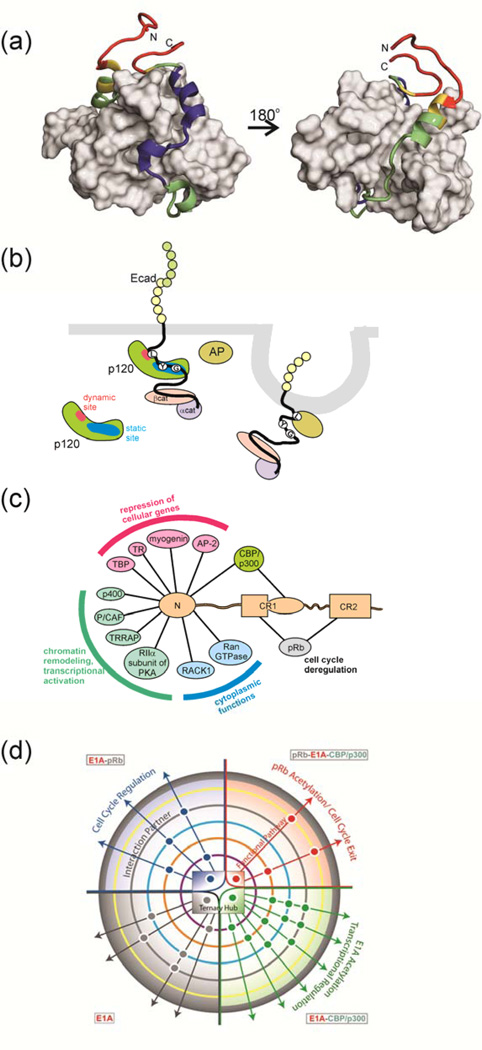
Figure 2. Variable Binding Affinities of IDPs.
(a) One member of an NMR-derived family of the structure of the complex between the folded CBP TAZ1 domain (grey surface) and the transactivation domain of RelA (NFκB p65)65. Backbone dynamics of RelA in the complex were estimated using 1H-15N NOE measurements, and are mapped onto the RelA backbone in red (most flexible), yellow (less flexible), green (less flexible again) and blue (least flexible). The regions of RelA colored blue coincide with the hydrophobic docking interactions that dominate association with the TAZ1 domain65. The N-terminal helix (green) is only transiently populated, and is dynamically disordered on a nanosecond timescale, yet contributes to binding affinity. The figure was made from coordinates 2LWW and data in 65. (b) Schematic illustration of pathway cross talk mediated by differential binding of an IDP. The disordered cytoplasmic tail of E-cadherin binds to the armadillo repeat region of the p120 catenin through interaction of conserved sequence motifs containing phosphorylated tyrosines (Y) and glycines (G) at a high-affinity static binding site (blue), while the LL motif binds at the dynamic site (red), effectively chaperones this region. The adaptor protein (AP) recognizes the exposed LL motif, leading to clathrin-mediated endocytosis of E-cadherin. Figure adapted from 62. (c) Interactions between adenovirus E1A and cellular proteins. The intrinsically disordered N-terminal region of E1A binds numerous cellular proteins to disrupt cellular regulation. Interactions that function in the repression of cellular genes are shown in pink, in chromatin remodeling and transcriptional activation in green and in the cytoplasm in blue. Interactions with pRb (gray) are essential for deregulation of the cell cycle, while binding to CBP/p300 (green) disrupts cellular transcriptional programs. (d) Schematic summary of the allosteric modulation of the E1A signaling network through complex formation with CBP and pRb. Signaling pathways are modulated allosterically by interactions with various binding partners, as represented by a central phase diagram of the hub, with four states of E1A: free (gray), E1A–pRb (blue), E1A–CBP/p300 (green) and ternary complex (red). Circles outside the hub show additional protein partner interactions that influence regulatory pathways within the cell. Figure reproduced from 63 with permission.

