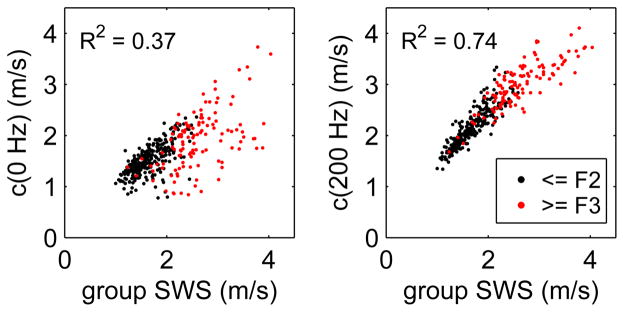
Fig. 5.

Scatter plot showing the comparison of the phase velocities found using frequencies of 0 Hz (left) and 200 Hz (right) with the group SWS measurements. Results are shown for 374 individual acquisitions in 98 subjects with low fibrosis (≤F2, black) and high fibrosis stage (≥F3, red). The coefficient of determination R2 is shown for each case.
