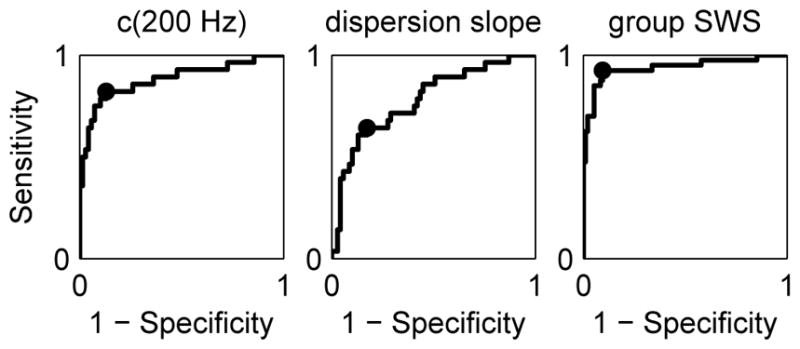
Fig. 7.

ROC curves for separation of fibrosis stages ≤F2 and ≥F3 obtained using c(200 Hz) (left), dispersion slope (center), and group SWS (right) as the threshold parameter. The optimal sensitivity and specificity is indicated on each plot. Values of AUROC, optimal sensitivity, and optimal specificity are given in Table II.
