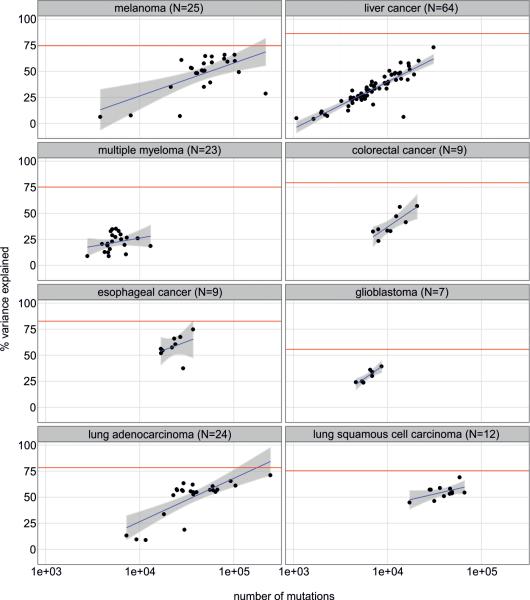
Extended Data Figure 4.
Prediction accuracy of the models trained on individual cancers as a function of the number of mutations. The red line represents the prediction accuracy of the model used to predict the mutation density of samples pooled by cancer type (sum of all mutations in individual cancers of a certain cancer type). N – number of individual cancers per cancer type.

