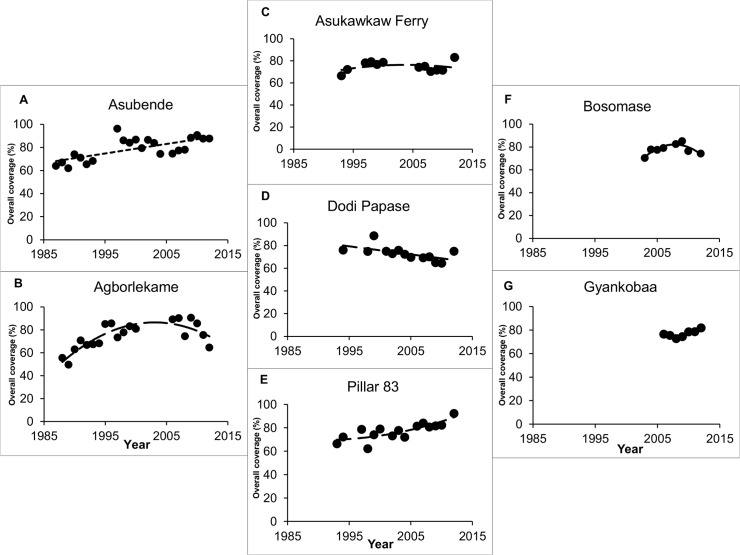
Fig 5. Therapeutic coverage of ivermectin treatment in all study villages.
The plots show the percentage of the overall population treated at each ivermectin round since mass ivermectin distribution began: (A) Asubende and (B) Agborlekame in the Brong-Ahafo Region; (C) Asukawkaw Ferry, (D) Dodi Papase and (E) Pillar 83 in the Volta Region; (F) Bosomase in the Western Region, and (G) Gyankobaa in the Ashanti Region. The dashed lines are the best fit least squares polynomial functions to the data, presented to facilitate visual inspection of the coverage trends. Biannual ivermectin distribution started in 2009 in Asubende, Agborlekame and Gyankobaa, whilst annual distribution has continued in the remaining villages.

