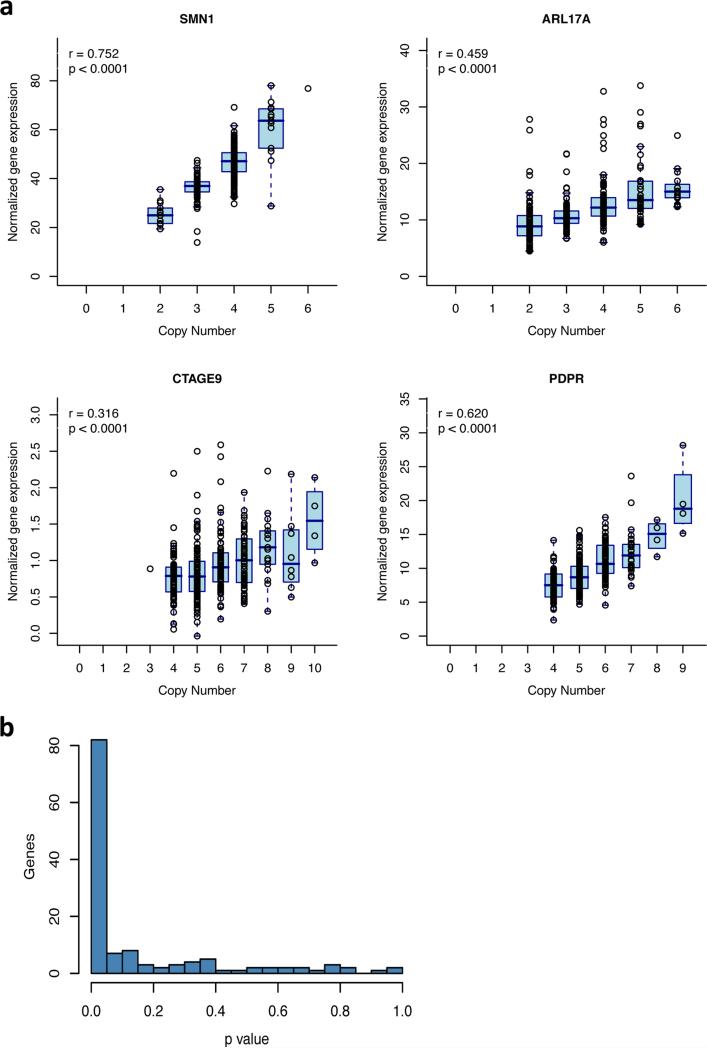
Figure 4.
Relationship of gene copy number (in genomic DNA) to gene expression (in mRNA) for multi-allelic CNVs. (a) At four typical genic mCNVs, inter-individual variation in gene expression levels appears to arise strongly from gene dosage variation. For clarity, individual points show data for all 310 genomes that have corresponding RNA data (not just outliers) overlaid on a summary box plot showing median, inter-quartile range, and whiskers extending to the most extreme point no more than 1.5 IQR from the box edge (Tukey convention). Supplementary Figure 8 shows such analyses for many more genes. (b) Across all genic mCNV loci that are expressed in lymphoblastoid cell lines, the distribution of p-values (in tests for positive correlation between gene expression and gene dosage) is dominated by low p-values. P-values calculated using 10,000 random permutations (Supplementary Note).

