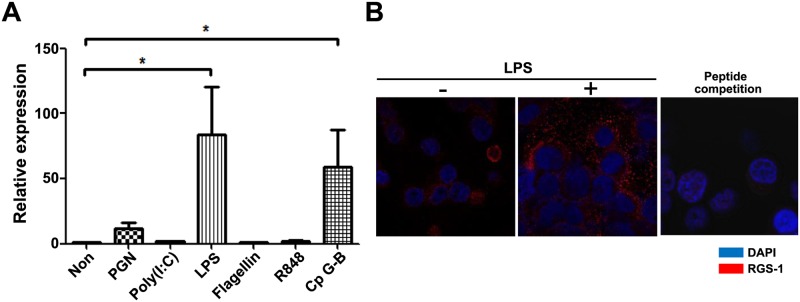
Fig 1. LPS increases RGS1 expression in RPMI 8226 cells.

A) Quantitative PCR analysis of RGS1 expression in TLR ligand-treated RPMI 8226 cells. Cultured cells were stimulated with PGN (peptidoglycan) (10 μg/mL; TLR2), poly (I:C) (1 μg/mL; TLR3), LPS (10 ng/mL; TLR4), flagellin (50 ng/mL; TLR5), R848 (3 μM; TLR7), and CpG-B (2 μM; TLR9). After stimulation, cells were harvested and quantitative PCR analysis was performed, as described in the Materials and Methods section. Data show the relative expression levels of RGS1 normalized to the relative S18 expression level of each mRNA (*p <0.05). B) RGS1 expression in LPS-treated RPMI 8226 cells. Cells were cultured in the presence or absence of LPS for 18 hours. To examine the specificity of the RGS1 antibody, the peptide competition assay was performed by addition of RGS1 peptide (1:1 molar ratio with antibody) in antibody binding reaction of ICC. Images shown are the representatives taken under 1000× objective magnification by a confocal microscope.
