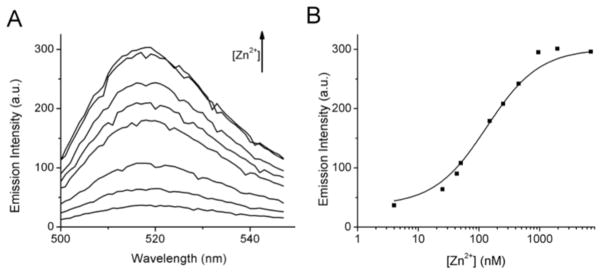
Figure 4.

Characterization of ZIMIR-HaloTag. (A) Zn2+-dependent fluorescence enhancement of ZIMIR-HaloTag. Zn2+ concentrations (from bottom to top) were 4, 25, 50, 150, 250, 450, 950, and 1950 nM. (B) Zn2+ titration curve of ZIMIR-HaloTag as measured from its emission at 515 nm. The solid line represents the fit using the equation mentioned in the Methods.
