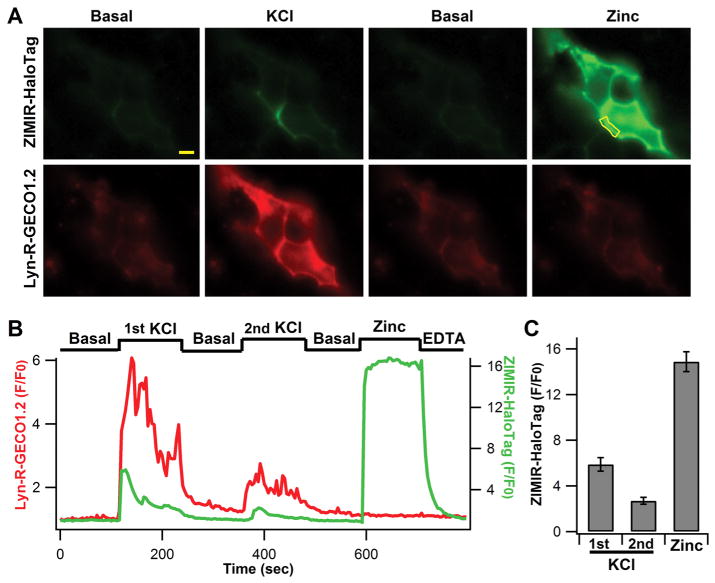
Figure 5.
Live cell imaging of Zn2+/insulin release with ZIMIR-HaloTag. (A) Example images of MIN6 beta cells cotransfected with HaloTag (pDisplay) and Lyn-R-GECO1.2 and sequentially incubated in the basal medium with 10 μM EDTA and 2 μM DPAS, 40 mM KCl, basal medium, and a high Zn2+ buffer (1 μM). Scale bar = 5 μm. (B) Corresponding time courses of Lyn-R-GECO1.2 and ZIMIR-HaloTag fluorescence at the release site (outlined by the yellow line in A). At the end of the experiment, cells were washed with the basal medium containing 2.5 mM EDTA. (C) Average ZIMIR-HaloTag fluorescence enhancement (peak value over baseline, N = 11 cells) in response to repetitive KCl stimulations or addition of 1 μM Zn2+.

