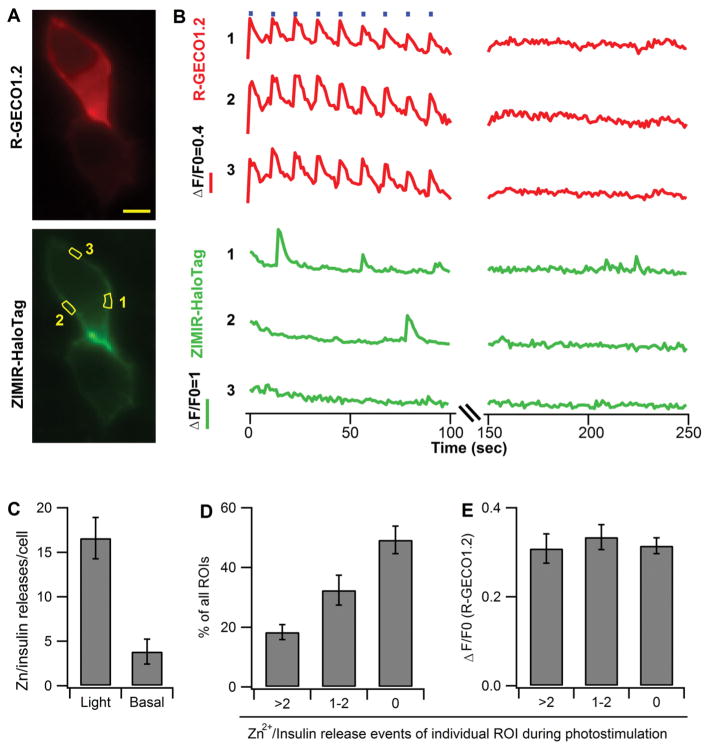
Figure 6.
Activation of channelrhodopsin led to Zn2+/insulin secretion events in discrete membrane domains in beta cells. (A) Example images of MIN6 beta cells cotransfected with ChR2(T159C)-R-GECO1.2 and HaloTag (pDisplay). Scale bar = 5 μm. (B) Time courses of R-GECO1.2 and ZIMIR-HaloTag in three example regions of interest (ROIs 1, 2, and 3 as outlined in panel A) during photostimulation (1 s × 9 repetitions, represented by blue bars at the top of the plot during the first 100 s) and post-stimulation (150–250 s). (C) Average number of observed Zn2+/insulin release events per cell either with light stimulation (1 s × 9 repetitions) or without light activation (basal). N = 6 cells. (D) Histogram of cellular membrane subdomains exhibiting different activities of Zn2+/insulin secretion during ChR2(T159C) activation. The analysis arbitrarily divided the entire plasma membrane of individual cells into small ROIs and counted Zn2+/insulin secretion events within each ROI. N = 6 cells with ~16 ROIs/cell. (E) Corresponding cellular Ca2+ activities of three classes of ROI showing different secretory activities analyzed in panel D.

